Identify Missing, Corrupted & Anomalous Data with Anomalo & Databricks
May 23, 2022
An organization’s data quality erodes naturally over time as the complexity of the data increases, dependencies are introduced in code, and third-party data sources are added. Databricks customers can now use Anomalo, the complete data quality platform, to understand and monitor the data quality health of their tables.
Unlike traditional rules-based approaches to data quality, Anomalo provides automated checks for data quality using machine learning, which automatically adapts over time to stay resilient as your data and business evolves. When the system detects an issue, it provides a rich set of visualizations to contextualize and explain the issue, as well as an instant root-cause analysis that points to the likely source of the problem. This means your team spends more time making data-driven decisions, and less time investigating and fire-fighting issues with your data.
Furthermore, Anomalo is designed to make data health visible and accessible for all stakeholders: from data scientists and engineers, to BI analysts, to executives. Anyone can easily add no-code rules and track key metrics for datasets they care about. Anomalo lets you investigate individual rows and columns, or get a high level summary of the health for your entire lakehouse.
Monitoring data quality in your Lakehouse tables
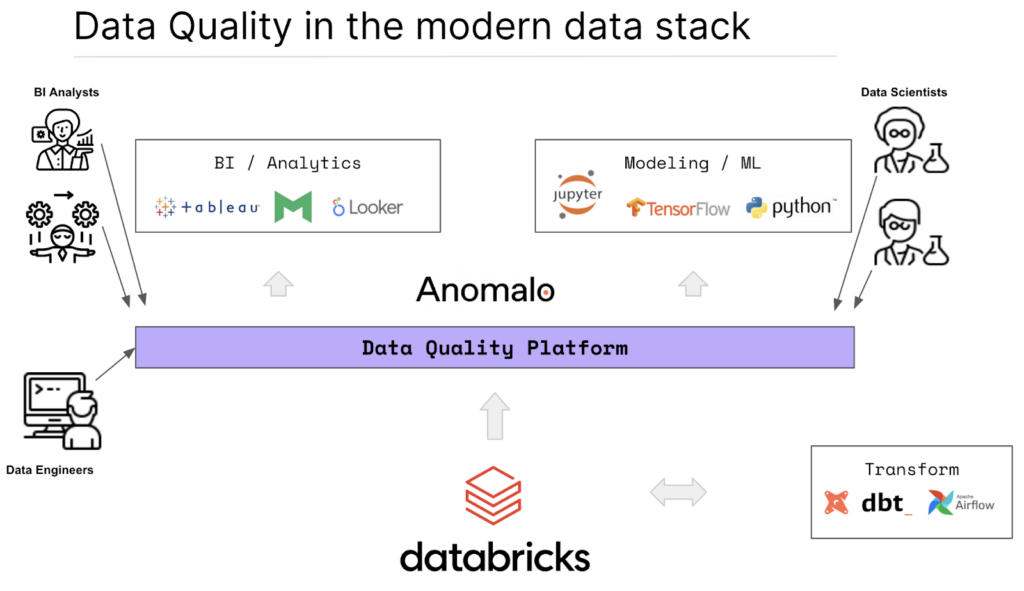
The Databricks Lakehouse Platform combines the best elements of data lakes and data warehouses to deliver the reliability, strong data governance, and performance of data warehouses with the openness, flexibility, and machine learning support of data lakes.
By connecting to Databricks, Anomalo brings a unifying layer that ensures you can trust the quality of your data before it is consumed by various business intelligence and analytics tools or modeling and machine learning frameworks. Anomalo is focused on providing transparent monitoring and insights into the individual tables in your lakehouse.
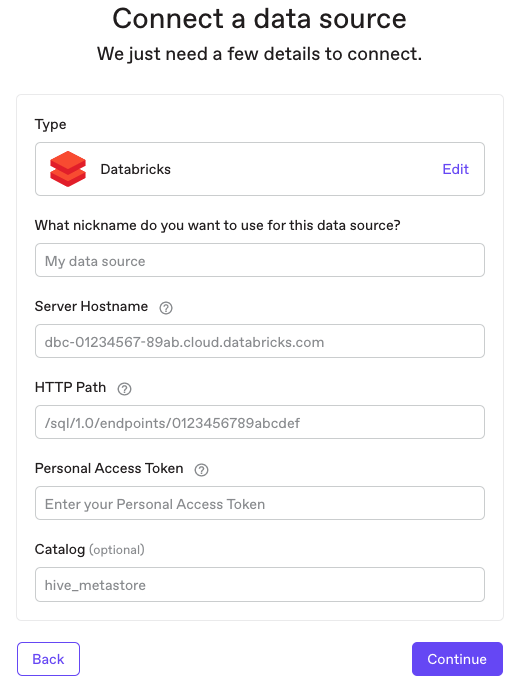
1. Connecting Anomalo to Databricks
Connecting Anomalo to your Databricks Lakehouse Platform is as easy as adding a new data source in Anomalo in just a few clicks.
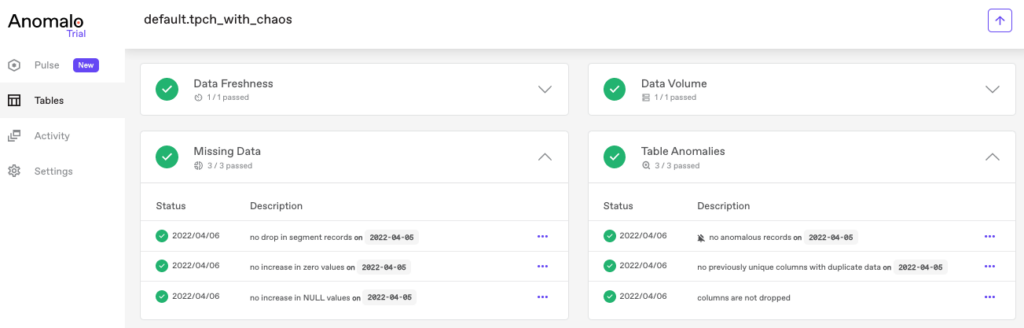
2. Identifying missing and anomalous data
Once Anomalo is connected to Databricks, you can configure any table to monitor data quality issues. Anomalo will then automatically monitor tables for four key characteristics:
- data freshness,
- data volume,
- missing data, and
- table anomalies.
Freshness and volume checks look for data that’s delivered late, or if the amount of data received is less than usual. Missing data might occur if a segment of data was dropped or null data has spiked in a column. Table anomalies, or anomaly detection, include duplicate data, changes in the schema of the table, as well as other significant changes inside the raw data, such as changes in continuous distributions, categorical values, time durations, or even relationships between columns.
3. Setting up no-code validation rules and key metrics
Besides the automatic checks that come built into Anomalo, anyone can add their own checks with no code (or with SQL). This lets a domain expert introduce constraints that certain data should conform to, even if they’re not an engineer. You can also add key metrics that are important for your company, or metrics that show whether the data is trending in the right direction.
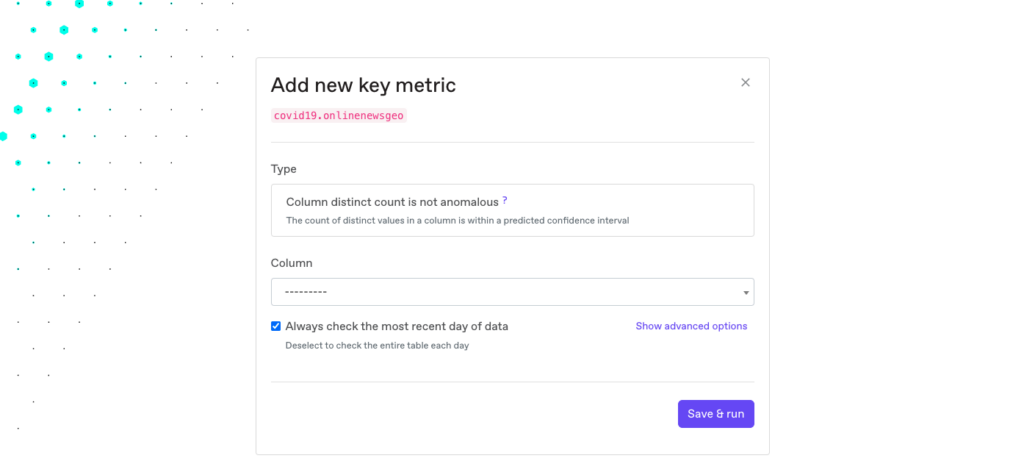
Through the UI, any internal user can quickly specify data requirements and KPIs. Arbitrarily complex checks can also be defined with SQL.
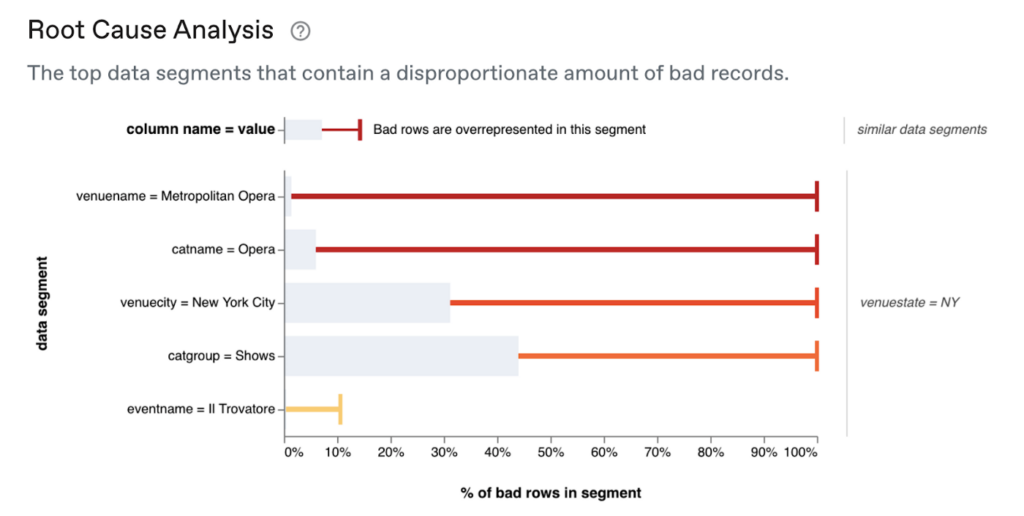
4. Alerting and root-cause analysis
If your data fails any automatic monitoring or is outside the bounds of the rules and metrics you specify, Anomalo immediately issues an alert. Teams can subscribe to these real-time alerts via email, Slack, Microsoft Teams, or PagerDuty. A fully-featured API is also available.
To triage data issues, it’s important to understand the impact and quickly identify the source. Users can go into Anomalo to see the percentage of affected rows, as well as a deeper root cause analysis, including the location of the failure in the table and samples of good rows and bad rows.
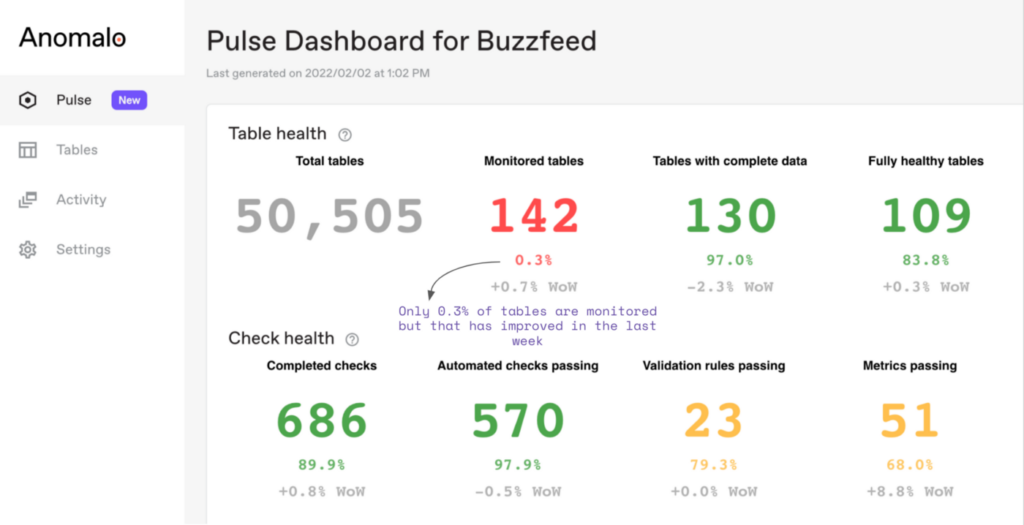
5. Understanding the data health of your lakehouse
Anomalo’s Pulse dashboard also gives users a high-level overview of their data quality to provide insights into data coverage, arrival times, trends, and repeat offenders. When you can make sense of the big picture health of the data in your organization’s lakehouse, you can identify problem areas and strategies for improvement.
Getting started with Databricks and Anomalo
Democratizing your data goes hand-in-hand with democratizing your data quality. Anomalo is a platform that helps you spot and fix issues with your data before they affect your business, as well as providing much needed visibility into the overall picture of your data health. Databricks customers can learn more about Anomalo at anomalo.com, or get started with Anomalo today by requesting a free demo.
Categories
- Integrations
- Partners
Related Resources
Learn more by browsing our library of announcements, guides, and technical deep dives on data quality.

Ready to Trust Your Data? Let’s Get Started
Meet with our team to see how Anomalo transforms data quality from a challenge into a competitive edge.