The Six (or More) Dimensions of Data Quality
April 3, 2024

If you spend time thinking about data quality like we do, you come across what’s called the Six Dimensions of Data Quality. If you dig in a little deeper like we have, you discover that there actually isn’t a consistent list of what these six are, but instead various interpretations. After all, it’s our business to figure out when things don’t match.
We aren’t here to settle the debate, but to learn from it. In fact, we’re adding to the discussion with another perspective from our CTO and co-founder. Regardless of which approach you choose, Anomalo can work for it, because we address data quality monitoring in so many different ways.
Why data quality matters
Data quality is about making sure that the data you’re using is as it ought to be.
There’s a lot that can go wrong with data at many stages, such as someone entering the wrong information in a field, a column being assigned the wrong unit of measurement, or even a table being deleted.
Bad data can lead to faulty public policy, sprinklers running when it’s raining, or spring break flights sold at low-season prices. The most exquisitely engineered automation or smartest researcher will give substandard results if they’re given faulty data, leading to all sorts of bad outcomes.
Good data quality practice includes thinking about what factors are important, monitoring a wide variety of factors, and reacting to issues as they emerge. Anomalo is a huge help with all of these.
How Anomalo approaches data quality
Anomalo is a data quality tool that monitors tables in the background to quickly detect (and alert you to) data issues. You can set up lightweight table observability for your entire data warehouse, and use advanced machine learning to monitor your most important tables without a lot of manual setup.
While Anomalo supports many rules-based checks, modern data quality at enterprise scale requires unsupervised machine learning (UML) too. UML observes tables over time, noticing characteristics like update frequency and the typical range of values within a column, and highlights unexpected deviations. While you can manually specify your expectations for the tables and columns most important to your business, the sheer volume of zero-, first-, and third-party data used today simply cannot be thoroughly monitored this way.
Anomalo’s UML can work in two ways. It can both simplify and strengthen your rules by understanding what’s normal—for instance, you can set up a table observability check if you’re concerned about data freshness, but let the machine figure out what normal looks like rather than manually specifying. It can also simply monitor for deviations from general patterns of all sorts, catching issues you might not have even thought to look for.
Detecting issues is only part of Anomalo’s value. With visualizations, statistical summaries, and automated root cause analysis, it helps you understand the breadth, scope, and impact of problems quickly. This improves trust in your data and helps keep things running smoothly. Anomalo integrates with data, communications, and project management tools, so you’ll get useful alerts where you can take action on them.
Data quality dimensions
Let’s take a brief look at the most commonly referenced data quality dimensions, including the questions they answer, a real-world or representative example, and a brief explanation of how Anomalo addresses each.
We found only three dimensions to be universal across the various “six dimension” frameworks we looked at:
Consistency: Is a given datapoint the same everywhere? The more places a given piece of data is stored and the more frequently it’s updated, the more opportunities there are for a mismatch. Consistency is particularly important to monitor when you’re migrating pipelines.
Example: If you’re a health insurance company, you want to ensure that information about the remaining deductible is the same both in what’s presented to the subscriber as well as the provider, even though these people are accessing different systems.
How Anomalo addresses: There are several ways to compare data in Anomalo to ensure consistency. One is comparing the results of the same SQL query on two different tables—for instance, is the average value of a certain column exactly the same in both. Another is a structural evaluation, ensuring the same schema, primary keys, and values in each row. Then there’s sample-based UML for continual monitoring. As with all errors it discovers, Anomalo’s root cause analysis will point you toward the likely issue.
Completeness: Do we have all the data we need for a given purpose? You don’t necessarily need all possible data for everything, but you oughtn’t be drawing conclusions if you don’t have both the right datasets as well as the right data in them.
Example: In 2016, Facebook acknowledged that it wasn’t counting videos seen for under three seconds in average viewing time reports to advertisers. This error damaged the platform’s relationship with top advertising agencies.
How Anomalo addresses: Our system can do two different kinds of checks for completeness. A metadata check can flag if the table lost rows it used to have, while a look at the actual data can observe whether you received all the new data you expected today. You can point Anomalo to pay particular attention to certain segments, such as a column or a certain value in a particular column.
Uniqueness: Is each piece of information held exactly once? While the same datapoint may live in multiple tables, it should be represented through metadata. Otherwise, you could be double-counting or more.
Example: In a CRM, each person should have exactly one entry. Duplicates should be prevented before they’re created, and merged if they already exist.
How Anomalo addresses: There are a few structured ways of catching duplicate entries. A data observability check would notice if the volume of new data has unexpectedly increased; if you’re suddenly getting 2,000 new rows when you expected 1,000, perhaps each is duplicated. The “no previously unique” check compares new data to existing to see if there are lookalikes. Or you can use the “multiple columns are unique when combined” validation rule to ensure that multiple columns are unique when combined to catch duplicate entries. The generalized UML algorithm is also adept at picking up on unexpected repeats.
These other dimensions showed up in some, but not all, of the frameworks we saw:
Validity (or Conformity): Is the data in the proper format? Dates, times, addresses, and even attached files need to conform to certain parameters. In some cases there is only one accurate choice, whereas in others you may have to decide which format option(s) to accept.
Example: Postal codes vary in length and format between countries. A US ZIP code is five digits (or optionally nine), whereas a Canadian postal code follows a specific alphanumeric format. A postal code is only valid if it matches the format for the specified country.
How Anomalo addresses: It’s best to catch these errors at the data-entry level—we’ve all seen those web forms that tell us we’ve entered a date wrong. Otherwise, use rules within Anomalo to monitor for various characteristics, such as proper date formatting, expected character length, or other factors. Unsupervised machine learning may even find errors you didn’t think to look for.
Timeliness: Are changes propagated ASAP? As so many more decisions are made in real time with automation, maintaining a speedy flow from source to analytics system is crucial.
Example: When data takes too long to get from the point of sale to the online ordering platform, grocers risk offering products for sale that they no longer have in stock.
How Anomalo addresses: There are two ways Anomalo can see if data flows are falling behind. A table observability check learns the typical frequency of updates based on your table metadata, and lets you know if the pattern shifts. There’s also a data freshness check that explicitly looks at a certain time to make sure new data has arrived since the last check. You can customize the cadence of these checks to your particular use case.
Accuracy: Does the data reflect the true state of things? Inaccurate data can emerge from myriad sources, from fat fingers to dirty sensors to flat-out lies. The cost can be anything from embarrassment to bankruptcy.
Example: An accidental extra zero from a Citigroup trader caused chaos in 2017, causing European markets to drop hundreds of billions of Euros.
How Anomalo addresses: Computers cannot directly assess whether a given piece of data is right—you can claim to be 5’8” and not 5’6” and nobody will be the wiser. But as our name suggests, Anomalo is great at finding anomalies, which are data points that don’t fit with observed patterns. You can specify which columns to specifically check for outliers, or simply rely on UML to crunch a bunch of numbers and point out anything out of line.
Integrity: Has the data remained the same throughout its journey? When data moves from one table to another and yet another, there’s always a chance that it gets messed up along the way. Strings get truncated, special characters turn into nonsense, or columns can end up with the wrong headers.
Example: A “coding issue” at Equifax in 2022 led to hundreds of thousands of consumers seeing their credit score shift up or down by 25 points or more.
How Anomalo addresses: If you don’t know enough about the issues you expect to see to develop custom checks, you can rely on the broad powers of unsupervised machine learning for “no anomalous records” monitoring. If you do, custom checks are the preferred way of ensuring that, for instance, a bunch of credit scores don’t suddenly deviate unexpectedly from the historical average or median.
Granularity/Relevance: Is your data at the right level of detail? You don’t want to flood your database with data to the 20th decimal point if all you need is integers, but you also don’t want your data to be so abstracted that you miss important patterns.
Example: When working with data about people in sensitive contexts, overly granular data can make it possible to identify particular individuals.
How Anomalo addresses: This is up to humans to decide. Unsupervised machine learning and sophisticated rules can keep you informed of issues with new and changing data, but in this case, data teams and their partners need to evaluate ethics, regulations, and business considerations around how much detail to store and display.
If you really want to go down the rabbit hole, there are yet even more ways to slice it. One source that looked across various perspectives from the past few decades came up with 11, with additional factors such as Lineage and Currency. A group in the Netherlands even ended up with 50 (PDF; see table starting on page 18).
Anomalo’s CTO’s perspective on data quality issues
Our CTO, Jeremy Stanley, lays out a more structural approach as the co-author of a recent book with O’Reilly, Automating Data Quality Monitoring. (Get a copy of it with our compliments.)
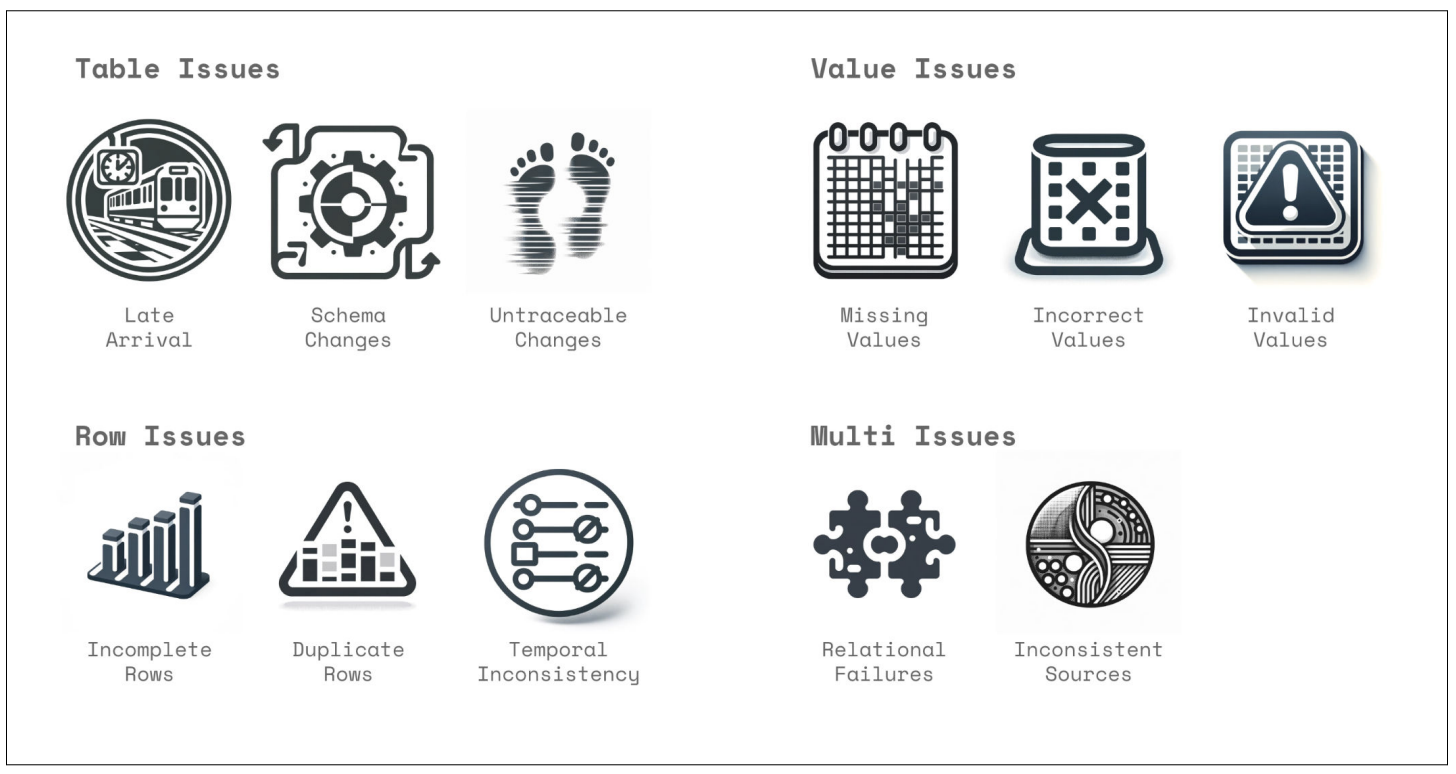
Jeremy categorizes issues in terms of how they present themselves in the context of the data itself: table, value, row, or “multi.”
The following description is a lightly adapted excerpt from the book.
- Table issues affect the entirety of the table, and aren’t specific to individual rows or values:
- Late arrival: When data arrives late and is not available to a consuming system by the time the system needs the data
- Schema changes: When there are structural changes in the data such as new or dropped columns, changes in column names, changes in data types for columns, or changes in the JSON schema in semistructured columns
- Untraceable changes: When the records in a table are updated in place in ways that cannot be audited after the fact
- Row issues affecting entire rows of data in the table:
- Incomplete rows: When data arrives, but only a fraction of the rows exist that ought to be there; usually, a specific segment of data is missing
- Duplicate rows: When the same row appears multiple times in the data when it was only intended to appear once
- Temporal inconsistency: When there are discrepancies or inconsistencies in the timing or sequencing of related data records
- Value issues affect specific values or cells of data:
- Missing values: When values in a column in a dataset are not populated, and instead appear as NULL, zero, empty strings, or other sentinel values that represent the absence of data
- Incorrect values: When the values in a column are incorrect, due to either a miscoding issue at a record level, or a structural error that misrepresents some or all records
- Invalid values: When values fail to conform to specified formats, constraints, or business rules
- Multi issues are about how multiple tables relate to one another:
- Relational failures: When the relational integrity between two data sources fails for some records, leading to duplicate or missing joins
- Inconsistent sources: When there are differences in data values over time or across data sources that should otherwise be identical
Some of these map fairly directly to various dimensions: “Incorrect values” is a failure of Accuracy, “Duplicate rows” is a lack of Uniqueness. Others are novel relative to the other dimensions we’ve seen, such as “Temporal inconsistency” and “Missing values.”
The importance and practice of data quality today
Data quality is not a new concern. Over the course of decades, as practitioners have defined and evolved the important aspects of data quality, they have developed valuable techniques to detect errors and troubleshoot issues. Traditionally these have been manually-coded rules, which can look out for issues you anticipate, but not the ones you don’t.
At today’s scale of data generation and consumption, it’s infeasible to hire armies of data-rule writers. Even if you could somehow develop enough rules to cover all the problems you can think of on all your tables, you’d still miss the unexpected ones. In previous decades, human intervention was more likely to catch bad data before it had an impact. Today, with so much automation, errors can directly lead to money wasted, customers lost, and other consequences.
Anomalo was designed to meet the challenge. Whatever’s important to you, our platform can reliably monitor for—and we might even catch issues that didn’t make your list. Let’s have a chat about your known and unknown data quality issues.
Related Resources
Learn more by browsing our library of announcements, guides, and technical deep dives on data quality.


Ready to Trust Your Data? Let’s Get Started
Meet with our team to see how Anomalo transforms data quality from a challenge into a competitive edge.