An Innovative Approach to Detecting Extreme Data Events
November 16, 2021
When analyzing data, we often think about high-level metrics — how much revenue did we generate yesterday? How many users queried this API end-point? How many times was this product purchased?
But sometimes these high-level metrics can become heavily skewed by extreme events.
For example, a bug in processing a discount code can allow a customer to checkout with a -$10 shopping cart. This might go unnoticed for a while, allowing the code to be shared online. Now thousands of customers are checking out with negative shopping carts, affecting your revenue and profitability metrics.
In other cases, such events don’t affect metrics, but can still negatively impact your business. For example, a new IP address can begin generating 3% of your site visits because a competitor is scraping your site. If undetected, the competitor can spend days or weeks with unrestricted access to your content.

Staying on top of these rare events can be a daunting task in a warehouse containing 100s of tables with 1,000s of columns and millions or billions of rows of data. As such, an automated solution is crucial.
Such rare events are called outliers. And in the rest of this article, we’ll briefly cover traditional outlier detection approaches and why they don’t work well for most real-world use cases.
Then we’ll explain our automated solution to outlier detection, and show examples using public data from New York 311 incident reports.

There are many algorithmic approaches to detecting outliers in samples of data. For example, from the sci-kit learn documentation, we have this comparison of techniques on a toy dataset:
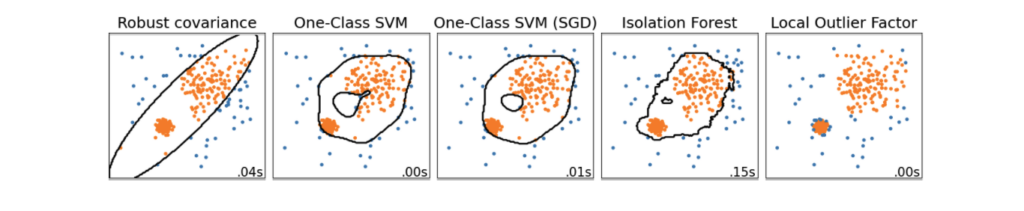
In the above visualization, each column is an outlier detection method. Each point is colored blue if the approach has classified it as an outlier and orange otherwise.
In this example, all of these methods appear to be reasonable. But such “toy” datasets fail to capture the complexity of identifying outliers for a real business amassing vast volumes of data.
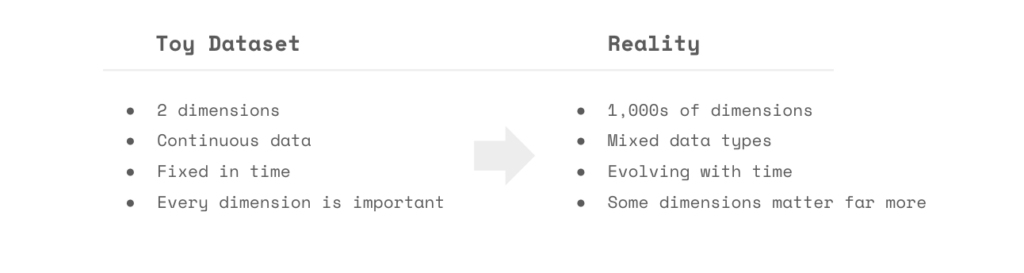
Real-world applications have tens or hundreds of columns of data in a wide range of formats, not just two continuous values. Data also changes over time — what was an outlier six months ago may have become a regular event today.
There are also many outliers in real-world datasets that are simply irrelevant. The user that bought 500 lemons may be an outlier, but the business may not need to do anything in response.
Finally, such approaches can be challenging to interpret, especially when working with large datasets. Understanding why a specific data point is an outlier is critical to informing any action taken.
At Anomalo, we have taken a practical approach to outlier identification with our Entity Outlier check.
First, we narrow the scope of the problem by requiring two pieces of input:
- What type of entity do we want to identify as an outlier?
- What specific metric do we want to evaluate for outliers?
For example, if we want to detect when new IP addresses begin scraping our site, then the IP address would be the entity, and site visits would be the metric.
Then we apply time series anomaly detection and root cause analysis techniques to provide very reliable, clear, and relevant outlier detection.
As an example, consider the following configuration for the New York 311 call service request data:
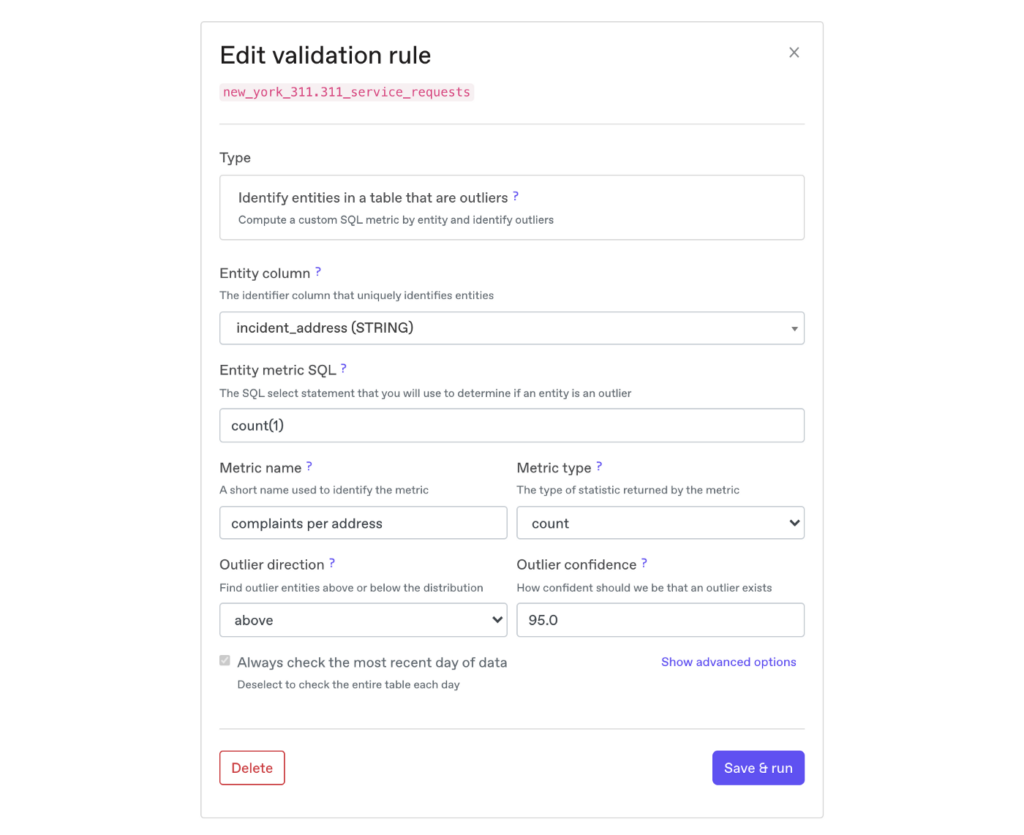
The entity we are monitoring here is the incident_address, which is the location in NY where the 311 incident report occurred. And the metric we are evaluating is the number of complaints per address, computed using the count(1) SQL snippet.
We are trying to answer the question: were there any addresses with an exceptionally high number of complaints on the most recent date?
The check creates a dataset that has the following shape:
address<: where the call was reported fromdate<: reporting datecomplaints: the number of complaints from that address on this date
We then take the maximum number of complaints by date, creating a time series with this shape:
date: reporting datemax_complaints: the maximum number of complaints received by a singleaddresson this date
Then we can model this as a time series and detect if there is an outlier on the most recent date:
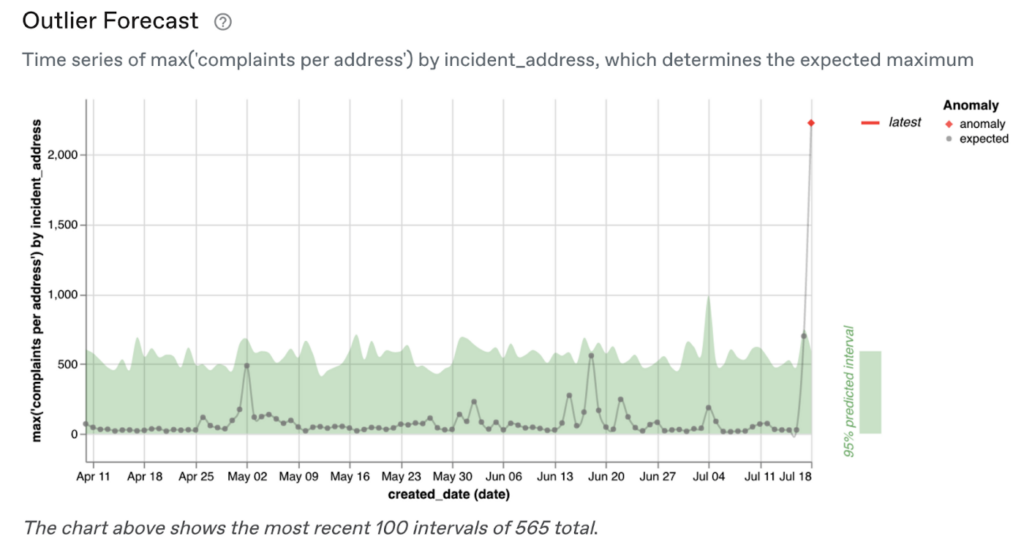
On most days, the maximum number of complaints is between 10 and 50, with regular spikes upwards of 500. But on the most recent date, July 18th, there was an address with 2,227 complaints, which is truly exceptional!
We can then automatically see which locations were responsible for this massive surge in complaints:
”
We then automatically profile all of the complaints about this address and compare them to other incidents that occurred on the same day to identify what segments characterize them:
”
In particular, it looks like 100% of the complaints at this location were of the ‘Loud Music/Party’ description, compared to only 35% of all other complaints on July 18th.
Either this was an epic party that irritated more than 2,000 people. Or a few people submitted complaints over and over again out of frustration. (Note that there is no information about who submitted the complaint in this dataset, so we can’t tell for sure.)
Extreme events can be incredibly important — in the words of Nassim Nicholas Taleb:
“I know that history is going to be dominated by an improbable event, I just don’t know what that event will be.” — Nassim Nicholas Taleb
Finding extreme events in a modern cloud data warehouse filled with Terabytes or Petabytes of data can be a very daunting task. Most outliers are meaningless.
But by narrowly focusing on key entities and metrics, and using robust time series models and root cause analysis techniques, we can clearly and automatically identify and explain the important ones.
Working with our customers, Anomalo has developed a targeted outlier detection approach that is easy to configure, well-calibrated, and provides rich and actionable context for users.
To get started with Anomalo, and begin identifying outliers pro-actively in your data, be sure to request a demo.
Related Resources
Learn more by browsing our library of announcements, guides, and technical deep dives on data quality.


Ready to Trust Your Data? Let’s Get Started
Meet with our team to see how Anomalo transforms data quality from a challenge into a competitive edge.