Root Causing Data Failures
November 9, 2021
When testing data, discovering the issue is only the first step. Once you become aware of a problem, many things need to happen to get your data back in good shape.
Usually, the resolution process begins by understanding where exactly in the data the problem is occurring. This requires an analyst to manually analyze failing records, write custom queries, or perform complex data analyses. Depending on the issue’s complexity, resources, and prioritization, such manual processes can take weeks. If that’s the case, it can cost the company millions of dollars, and backfilling the missing data can become impossible.
What if the root cause of a data failure could be generated automatically, as soon as the issue is identified? An automatic root cause analysis allows the team to spend less time spinning their wheels on manual investigations and more time creating actionable playbooks for resolving issues. As a result, more tests can be written with higher quality, and data issues are identified and resolved faster.
This article will walk you through finding the root cause by hand and via a machine learning model. Then, we will describe Anomalo’s automated system for identifying root causes and introduce a framework for understanding the classes of causes it can discover. Finally, we will conclude with an analysis of the impact this technology has on how teams respond to and resolve data quality issues.

The most direct way to evaluate the quality of a dataset is to apply validation rules. These are logical conditions that you believe every row in your data should satisfy. Validation rules can be simple, such as column is never NULL or more complex, such as column_a + column_b = column_c. These rules reflect beliefs about how the data is generated, processed, or stored. And in some cases, they ensure regulatory compliance.
While validation rules have limitations (see Dynamic Data Testing), their simplicity and comprehensiveness are unparalleled. If your data needs to be perfect in some way, you should use a validation rule to enforce it.
Consider the table fact_listing which includes a few thousand ticket sales listings for concert and sporting event tickets. For a quick overview of this dataset, consider the following Columns visualization from Anomalo:
Each column is shown along with its data type and distribution of the 10 most frequent values in a random sample of records. All other values are shown in grey, and NULL values are shown in red.
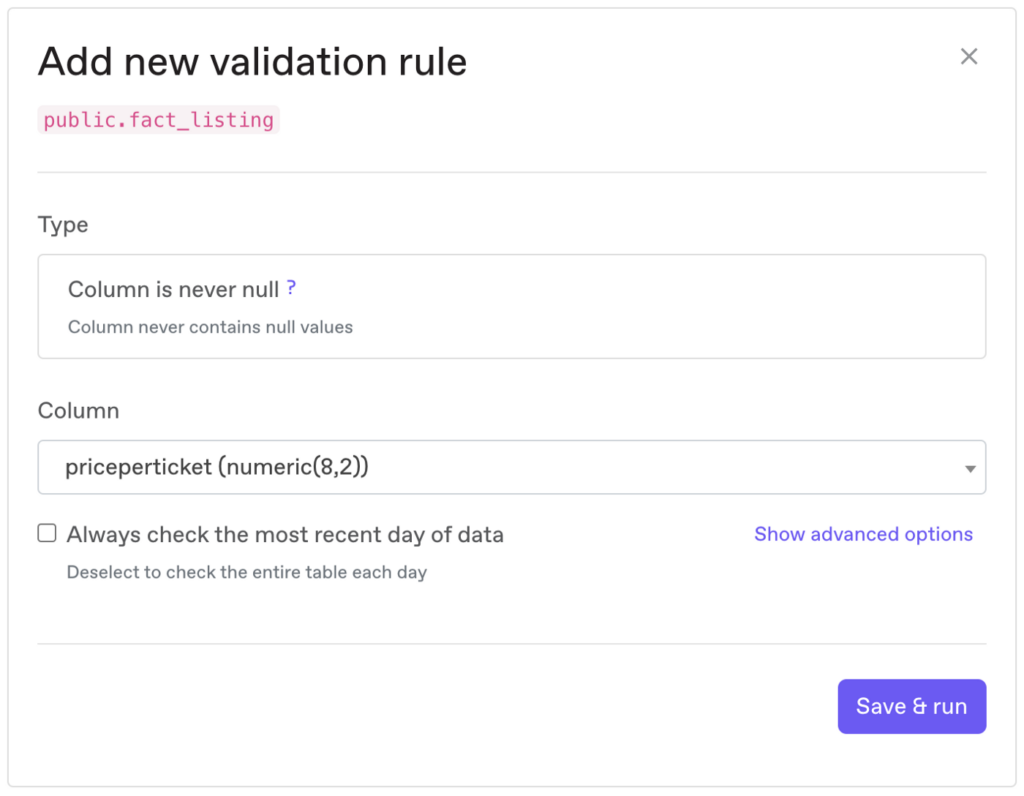
The column priceperticket is integral for charging customers the correct price and calculating revenue. A NULL value could allow thousands of event-goers to purchase tickets at no charge. As such, it is crucial that priceperticket is never NULL. To ensure that, we can create the following validation rule in the Anomalo UI:
Once we run the validation rule, we can see that priceperticket is NULL for 793 records.
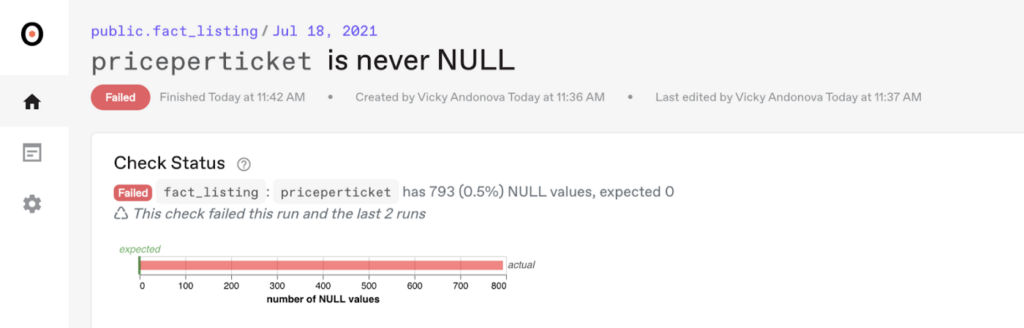
While these records make up only 0.5% of the table’s records now, the issue can propagate if not resolved. A missing priceperticket has a direct impact on revenue, and it can be fatal for venues, so we must investigate.

The first thing any analyst will do is to investigate the records that have NULL priceperticket. To do so, we can write the following query:
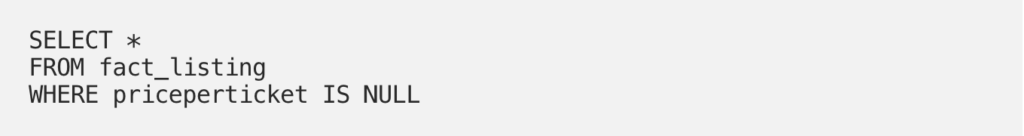
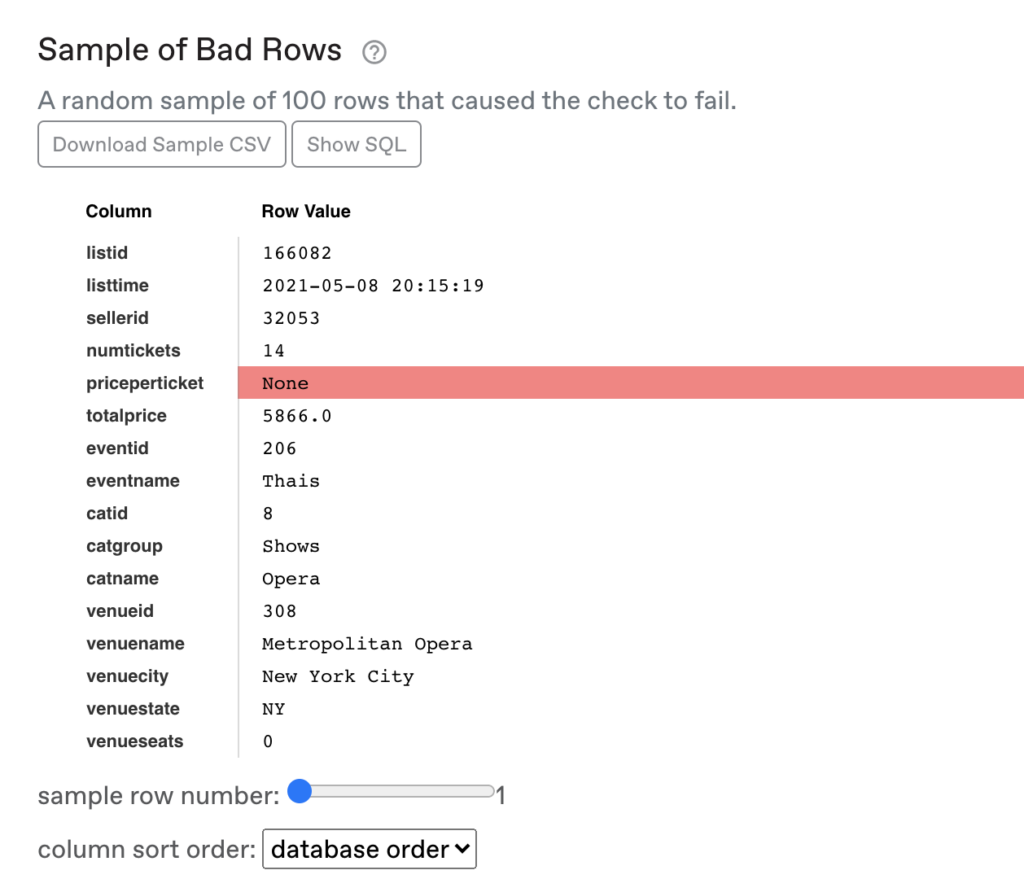
Given the data above, the analyst can immediately begin generating hypotheses for the root cause, such as “events in NY,” or “Operas,” or “Thais” performances. We can call these explanations segments, and we can think about them as WHERE SQL clauses that would allow us to filter the data to just the bad records.
But the analyst is reviewing a biased sample of the dataset and risks falling prey to survivorship bias. The same kind of fallacy is shown in this image of bullet holes in surviving WW2 planes. Namely, when looking for places to fortify the planes, most generals suggested adding armor to the areas where surviving planes had the most bullet holes. A statistician, however, correctly identified that the planes should be fortified in areas with no bullet holes since the places where no surviving planes have holes are those that are fatal.
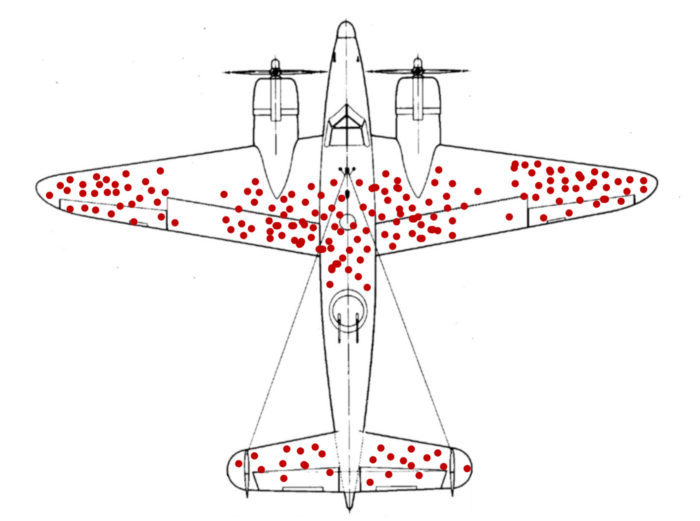
In our example, without analyzing the good data and understanding the population size for each segment, it is impossible to know from the bad data alone if we have found the explanation for the data quality issue or just a very prevalent segment of the data — or just noise.
We could begin to test each of the above hypotheses using SQL, for example:
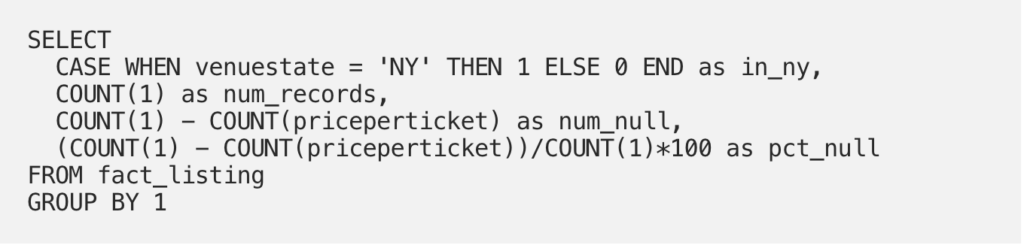
This query returns the following result:
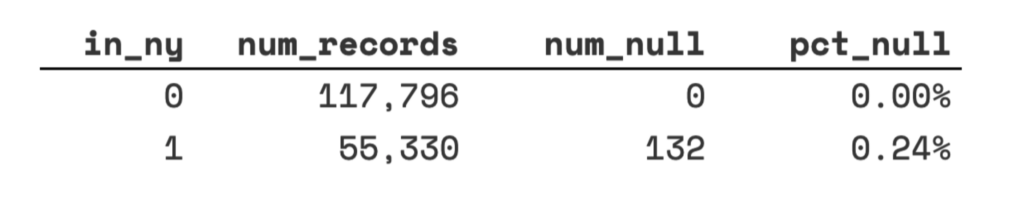
The result makes it clear that all of the failures have happened in NY. But is that really the best explanation?
One way to find out is to repeat the above query for every possible segment in the table. Even for a small table like this one, this is not a feasible solution. If each column can be segmented in 10 ways and there are 20 columns to evaluate per table, we have to execute and analyze 200 queries. This would put a great deal of unnecessary load on the data warehouse and the analyst — and thus company resources!
An alternative is to query for a sample of bad and good records and then use a machine learning algorithm (like a decision tree) to identify the good and bad records. One can then examine the split nodes of the learned tree to understand what decisions best separate the good and bad data.
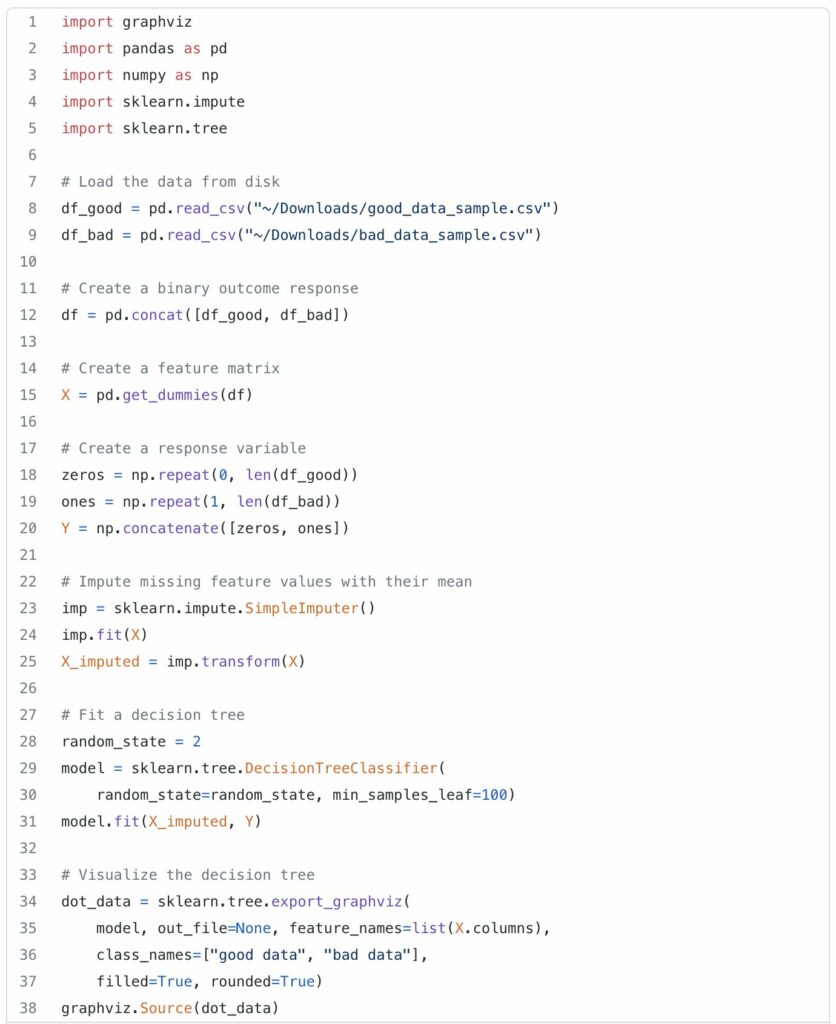
This produces a decision tree that correctly calls out the best root cause for this sample (the Metropolitan Opera venue):
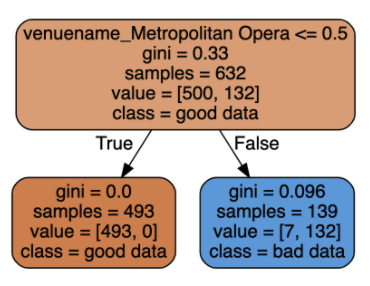
Unfortunately, the results are sensitive to the random seed and can easily overfit the data. Building such a model reliably requires domain expertise and human intervention, and as such, it is not feasible to automate at scale.
For example, minor changes in random_state or min_leaf_samples produce results that are more difficult to interpret:
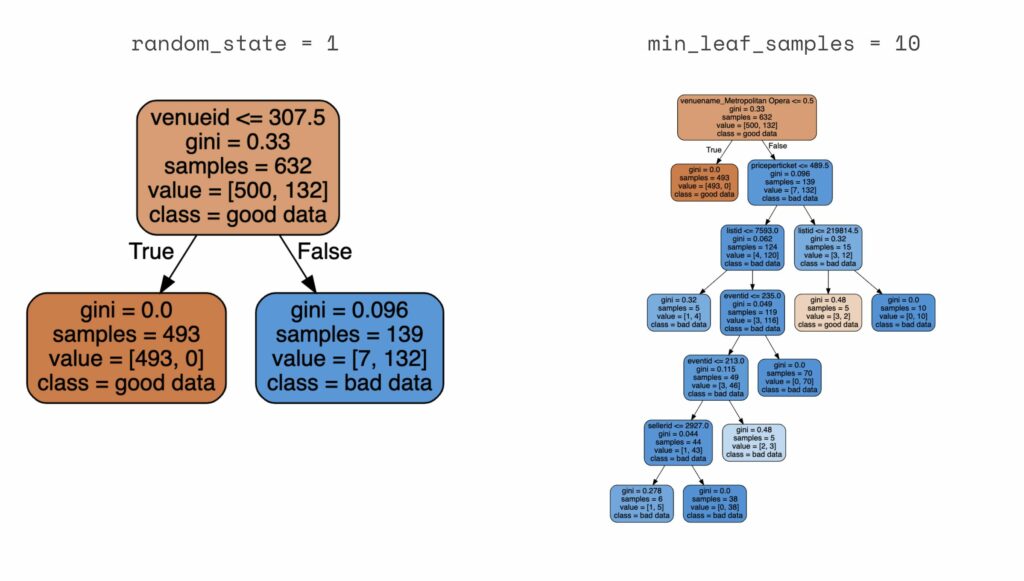
Both approaches leave the analyst in a time-consuming process which can feel like looking for a needle in a haystack. Most importantly, it can be a huge time sink that has to begin all over again when the next issue arises.
At Anomalo, we’ve built a tool to make this process quick and painless, so you can get back to extracting valuable insights from your data instead of spending all your time fixing it.
First, Anomalo allows you to quickly investigate your good and bad data without writing any extra queries. When an Anomalo user scrolls down on the status page, they will see both a sample of bad and good rows that they can scrub through or download.
More importantly, we provide an automatically generated root cause analysis. By analyzing all the possible segments independently and clustering the results, this analysis surfaces the segments with the greatest explanatory power to the user:
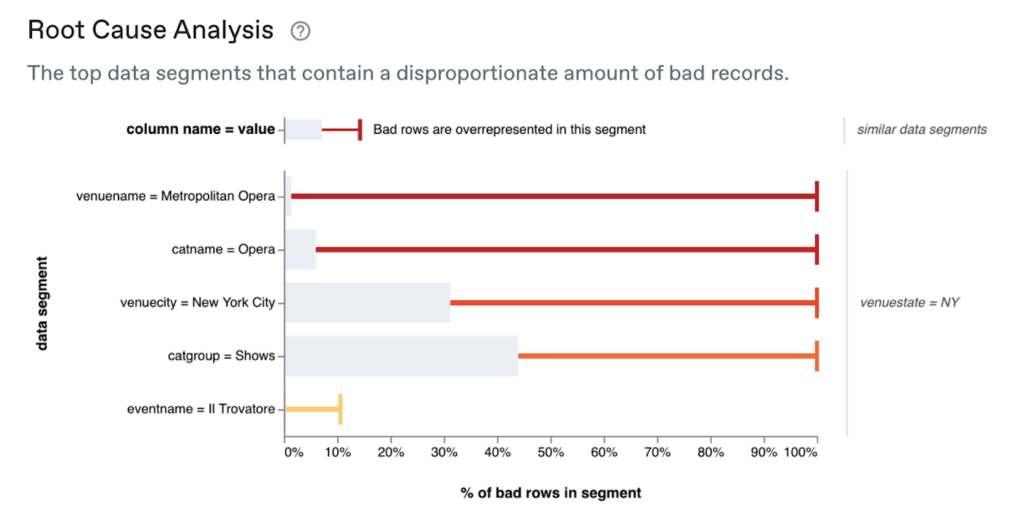
The chart above shows that venuename = Metropolitan Opera is the top explanation for exactly where the data quality issue has happened and ranks other potential explanatory factors. For example, it shows that even though venuecity = New York City captures 100% of bad data (red tick), it might not be our best candidate to narrow down where the problem is occurring because it is also quite prevalent in the good data (gray bar). This is in line with the findings from our manual analysis above, but this time, it took us no additional queries or hypothesis testing.
Leveraging a system of automated root cause analysis can dramatically improve the speed with which high-quality tests are developed, issues are triaged, and failures are resolved. This increases the chances that a data quality initiative is successful and reduces the expense and tedium of maintaining it.
So how do we do it? In practice, we have found that sophisticated modeling of the data isn’t necessary to get actionable insights. Instead, you can sample the data, analyze every segment independently, and cluster segments together that are highly related.
To explain how this works, consider the following diagram:
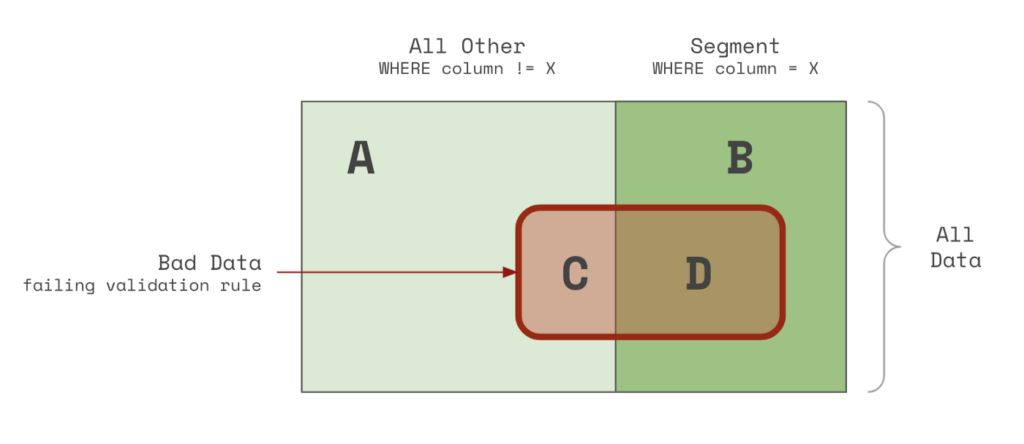
The rectangle above represents all of the data in the table. The data in the red area (C & D) are records that are failing the validation rule. Whereas the data in the green area (A & B) are passing the validation rule. Records on the right-hand side that are shaded darker (B & D) are inside the segment. Whereas records on the left-hand side that are lighter (A & C) are outside the segment.
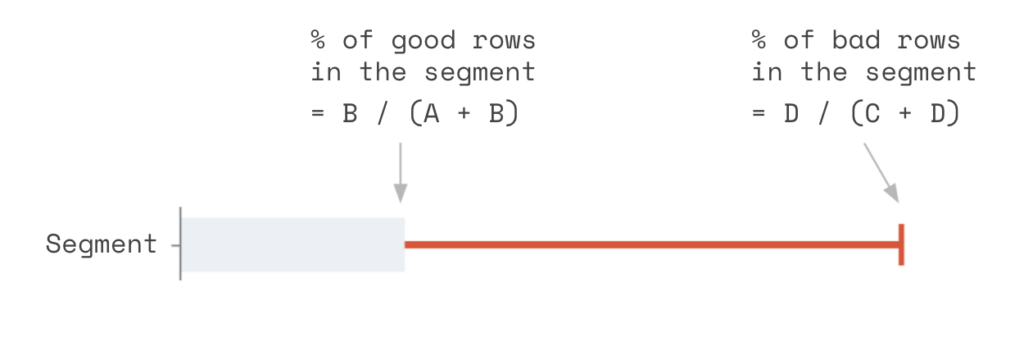
We can then compute the percentage of bad rows in the segment and the percentage of good rows. If the bad rows are far more prevalent than the good rows, we have found a segment that may help explain the issue!
Returning to our example with fact_listing, let’s examine a few of the segments from the root cause analysis.
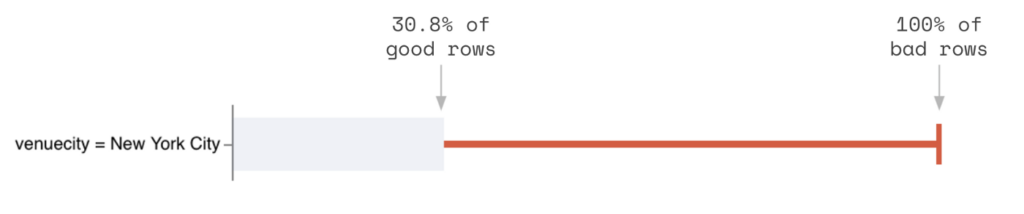
As mentioned before, while New York City contains all of the bad data, it also contains a lot of good data. So it isn’t as precise as we want.
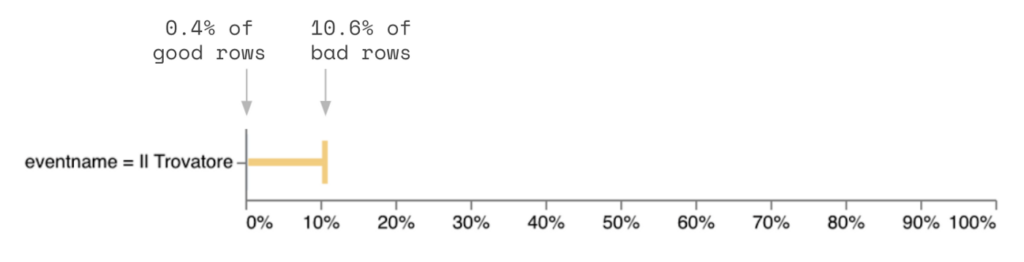
The Opera Il Trovatore contains very little bad data and doesn’t fully cover the issue (only 10.6% of bad data is included).
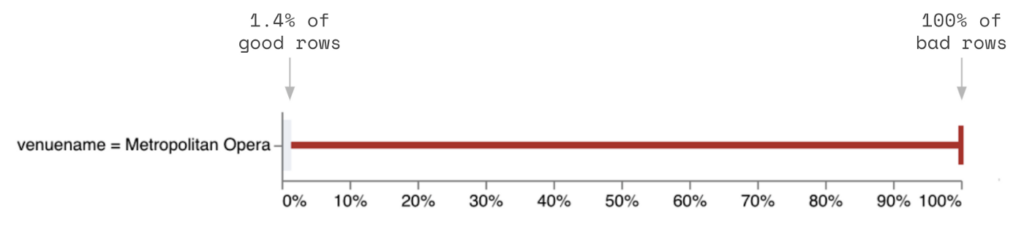
However, the venue Metropolitan Opera completely covers the bad data and contains only 1.4% of the good data. This strongly suggests that this venue is the root cause of the NULL priceperticket values.
To understand why this approach works, consider that a given segment that is related to the bad data will fall into one of the following four categories:
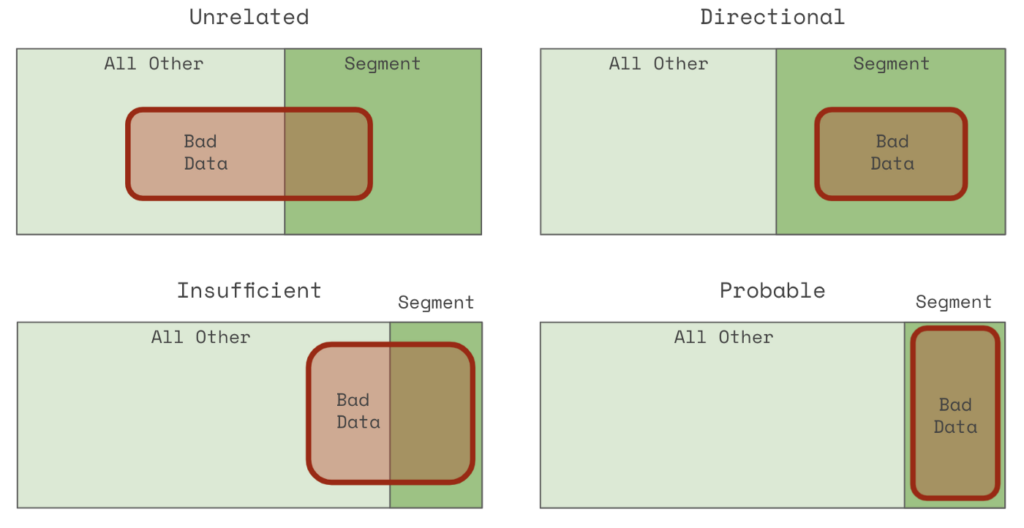
The four different alignments of potentially root cause segments (dark colors) with bad data (red).
An unrelated segment (upper left) contains almost the same proportion of bad data as the whole population. A directional segment (upper right) includes all of the bad data but is not very accurate — it also includes many good records. An insufficient segment is filled with mostly bad data but excludes many bad records as well. And a probable segment contains all of the bad data and very little else.
Tying this back to our example, venuename = Metropolitan Opera would be a probable segment, eventname = Il Travatore would be insufficient, and venuecity = New York City would be directional.
Using a system that automatically generates root causes for validation failures can dramatically change how data is tested. In practice, the root cause becomes the center of a data testing loop.
First, the user drafts a validation rule and runs it on an ad-hoc basis. Once they are happy with their configuration, they schedule it to run in production. As long as a rule passes, no further action is needed.
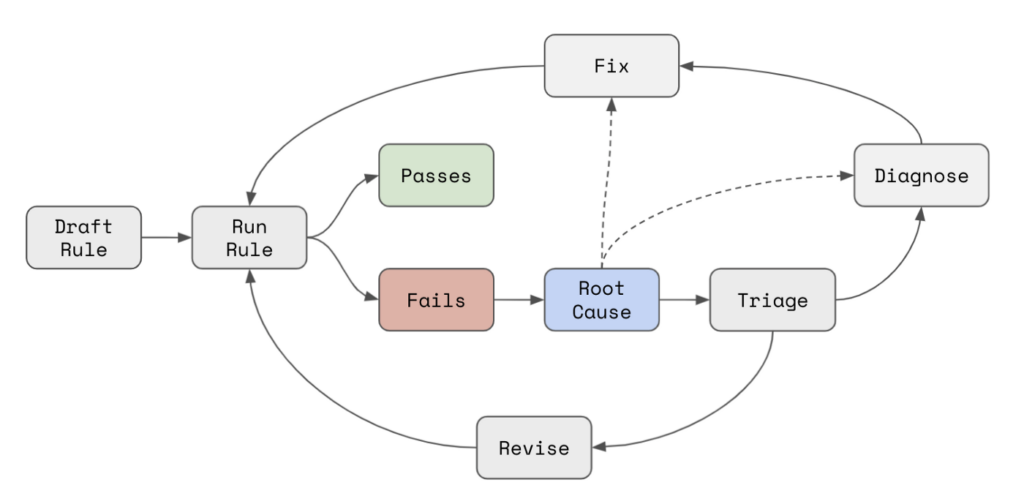
But rules often fail, and as soon as this happens, a root cause analysis is produced. Initially, this helps to triage the issue and identify if the failure is a false positive, which can occur because:
- The rule isn’t relevant for a subset of rows
- The logic of the rule needs to be adjusted
- The rule is not appropriate
The root cause analysis can identify exactly what filter needs to be applied and provide insight into what logic needs to be changed.
If the failure is a true positive, then the user needs to diagnose and then fix the issue. Here, the root cause is a critical first step towards identifying what needs to change and where and can also significantly narrow down the number of teams or partners that need to be consulted along the way.
By fully automating the root cause, we find that organizations can:
- Iterate on tests faster, allowing them to test more data with less time
- Triage issues more quickly, with greater certainty
- Resolve misconfigured checks faster
- Diagnose and fix real data quality failures faster
This leads to increased signal-to-noise, greater test coverage, and faster times to resolution.
In most systems, failing validation rules provide little insight into exactly what went wrong and where. Analysts can perform root cause analyses by hand, but they may be time-consuming, expensive, and prone to error. Anomalo provides a reliable, automated solution.
To learn more about how data teams use Anomalo to understand root causes automatically or find other ways in which Anomalo can help you better monitor your data, request a demo.
Related Resources
Learn more by browsing our library of announcements, guides, and technical deep dives on data quality.


Ready to Trust Your Data? Let’s Get Started
Meet with our team to see how Anomalo transforms data quality from a challenge into a competitive edge.