Chapter 6: High-quality notifications bring the right information to the right people at the right time
April 24, 2026

Welcome to “Use AI to modernize your data quality strategy,” a series spotlighting insights from our O’Reilly book, Automating Data Quality Monitoring. This post corresponds to Chapter 6: Implementing Notifications While Avoiding Alert Fatigue.
Finding an important data issue is only useful if the alert gets through to someone who can get it fixed. Our previous five chapters focused on finding issues in large datasets, and the ways in which modern data quality solutions can automate issue discovery. Now let’s focus on how and when to loop in humans.
The name of the game is balance. On one hand, you want to be alerted to the issues you care about, so you can deal with them before they turn into problems. On the other, alerts you don’t care about can very quickly lead to alert fatigue.
Here’s some practical, battle-tested advice on making sure your alerts give the most useful information to the people who can do something about it, while avoiding sending too many alerts.
How do alerts support data governance efforts?
A good alert tells you when something is wrong. A great alert takes that foundation and adds information that helps you find and resolve the issue. It’s the difference between suggesting a good restaurant and recommending a particular dish.
Alerts can support every stage of the issue resolution workflow, starting with triage.
Triage
When your team receives an alert, the first step is to assess whether an anomaly is actually something to worry about. Context and judgment is important here — you know if a recent cold snap is why ice cream sales are down, or if a mention by a celebrity explains a big traffic spike.
Because alerts implicitly create to-dos for their human recipient, it’s important that they be clear, concise, and structured so someone can easily pinpoint the issue.
Routing
If you conclude that the anomaly needs further investigation, the next step is deciding who is best suited to resolve the problem. The answer can be different across enterprises or even divisions. For example, at your company, you might involve the data engineering team for an ETL-based issue, and the product engineering team for an issue related to a codebase change. Sending alerts to the right people can take some manual effort in the configuration process, but that effort pays off by ensuring that issues quickly come to the attention of the people who can fix them.
Resolution
This step is about actually fixing the issue. Most of this is outside of the scope of our conversation, with one exception: Root Cause Analysis (RCA). These visualizations were already a powerful tool, but now that we’re entering the age of self-driving data, agents can help surface the source of issues in even more intuitive ways.
Documentation
Recording what happened and what you did about it, as soon as possible after resolution, helps in future issue resolution. Alerts, the associated RCA visualizations, and conversation logs with agents all provide helpful primary-source documentation that conveys what the system detected and show what the people fixing the problem first saw.
What goes into a useful alert?
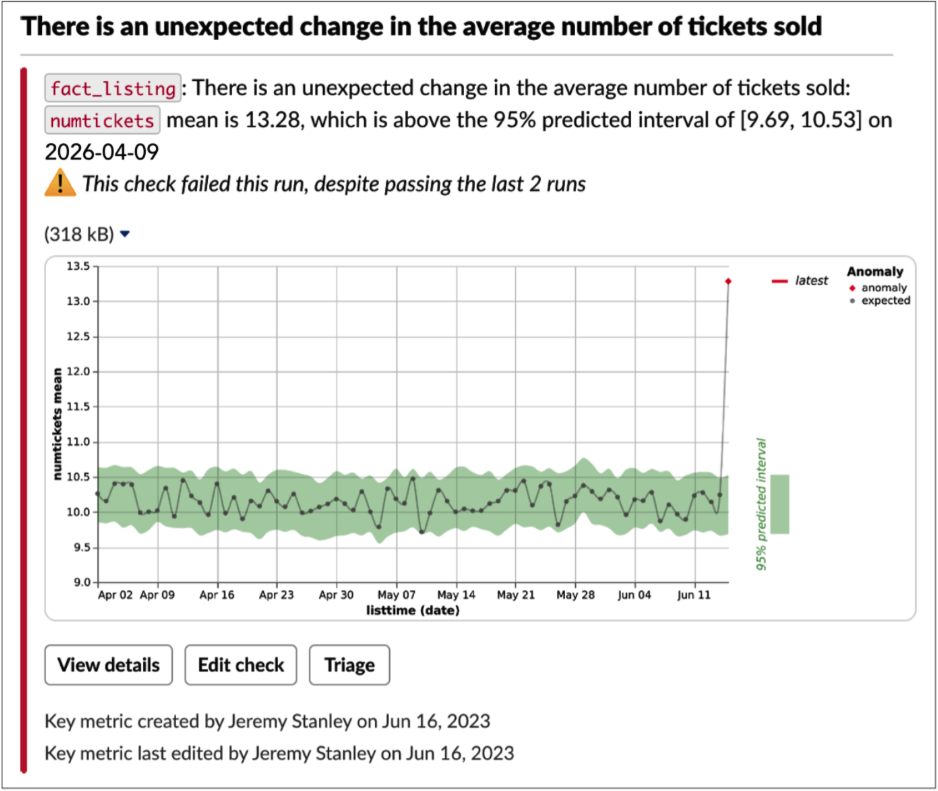
The ideal data quality alert contains just enough information for a human to decide if the issue merits further investigation, plus helpful links for common actions. Notification routing is also paramount, because a helpful alert sent to the wrong person becomes not very helpful at all. Here’s an example of a well-balanced alert:
Necessary information
Title. Especially crucial for an email, but relevant in any context, a very short title describing the issue quickly provides context and allows a first-order triage. If the recipient is already busy fighting another fire, they can decide whether to turn their attention here or wait until the other issue is in a stable place.
Description. An automatically generated summary, tuned to be both information-rich and easily parsed. The description in the above alert notes the table name (fact_listing), the column (numtickets), the issue (“unexpected change in the average number of tickets sold”), and the expected value. The history of this check makes clear if this is an emergent or previously seen issue.
Visualization. Stick to one, such as a chart. Anything more risks information overload. This one provides context, history, and information about the severity: one glance and you can tell that today’s data is way out of whack. Note that different notifications will probably require different visualizations.
Tracking details. For manually specified checks, such as validation rules and key metrics, it’s useful to see who created it and last edited it, and when. The recipient may wish to follow up with the creator for more background.
Quick action links
A well-designed alert helps your team get to work on issues faster by giving them immediate access to next steps. In the Slack alert above, note the three actions Anomalo offers:
- “View details,” for more details if necessary
- “Edit check,” which is useful if it’s a false alarm that you’d like to prevent in the future
- “Triage,” to begin the process of cataloging actions related to the alert
Delivery mechanisms
When designing an alert, pay attention to where the alert goes in addition to what the alert says. Each table and check should map to specific individuals or teams. Consider the following when deciding how to route notifications:
Audience. Who will be notified? Only those with a high degree of ownership of this data should get notifications. It’s not that people outside the audience should be locked out, they just probably shouldn’t get push notifications about the alert. An occasional user of a given table should see any relevant issues as they’re looking at the table, such as through an integration with your data platform.
Channel. How will someone get the notification? Send notifications to only one place, so all the related information is centralized. If multiple teams are involved (say, marketing and analytics both need to know if website visitor data is awry), create a specific channel or email list that they’re both monitoring, so all triage and troubleshooting discussion is centralized.
Beyond email and real-time communication (Slack, Teams), consider on-call management platforms (PagerDuty, OpsGenie), ticketing platforms (Jira, ServiceNow), and webhooks. Your alerts should end up where your team would find them most useful; anything short of that risks delayed or missed responses.
In order to avoid accidentally leaving a notification unrouted, make sure you have a default channel set up. Monitor this channel actively to clear up anything that could be routed better in the future.
Timing. When will the notification be sent? We recommend triggering a notification as soon as a check fails, rather than bundling alerts by table or day. The sooner you know about an issue, the sooner you can fix it. Don’t rely on summary statistics to flag issues: A recurring report is often overlooked, and is probably not a great way to get someone’s attention to a pressing issue.
How to avoid alert fatigue
The Boy Who Cried Wolf isn’t just a warning to kids to stop complaining about every little thing. It’s a useful parable for what can go wrong with over-alerting.
The core axiom is that the more non-useful alerts your team gets, the less responsive they’ll be when a useful one comes up. Some individuals and teams can be really, really sensitive to alert fatigue! Here’s what to do to minimize false positives while ensuring that actual issues get through.
Schedule checks in the right order. For example, don’t check for an increase in nulls before you’ve confirmed that all the expected data has arrived for the day. Otherwise, you might be working with an incomplete data set and throw false alarms. Generally, run observability checks first, then all other checks once those pass.
Cluster related alerts. If you’re seeing the same issue in multiple places (say, nulls in cc_number, cc_expiration, and cc_zipcode), send a single alert. After all, it’s very likely that there’s one core issue. With the list of columns above, we can infer the credit card feed may be broken.
Suppress low-priority notifications. Some alerts, such as those tracking a known issue, should notify rarely or never. One best practice is to allow recipients to set priority levels. At Anomalo, we offer three priority levels:
- Low: never alerts.
- Normal/medium: alerts on the first three check failures in a row, and then once a week if the check continues failing. Also alerts on the first pass after 3 consecutive failures.
- High: always alerts on failure, no matter how many times in a row.
Retrain continuously. After an anomalous event, the model should adjust to the “new normal” as quickly as possible, preferably by the next day. That way, a change that reflects reality (say, increased sales at the launch of an ad campaign) doesn’t continue to alert. As we covered in Chapter 4, the model you’ll use already covers this by retraining the model each day as new data comes in.
Allow flexible sensitivity. Let a user adjust how sensitive the check is. By increasing or decreasing a check’s confidence interval, they can make the model more or less tolerant of variation. Look at the number of red dots, which would be alert-worthy anomalies, for the same data with a 95% and an 80% confidence interval:

A word of caution: Don’t suppress expected changes! If you have a marketing push coming up, let your model alert you to a spike the first day. You’ll get context that might be useful for future analysis (root cause analysis, time of day, etc.), and you’ll verify that the change actually happened. Plus, you might accidentally suppress alerts for true unexpected errors. Alerts don’t mean things are wrong, just that they’re out of the ordinary.
Accelerate investigations with automated Root Cause Analysis
Now that you’ve optimized what’s in your alerts, let’s talk for a moment about Root Cause Analysis (RCA). While automated RCA shouldn’t be in the alert itself, this report should be shown in the next step of investigation.
Automated RCA speeds up investigations by showing which segments have a disproportionate amount of bad records. It can point out if, say, nulls are disproportionally coming from Michigan stores, or the amount of new accounts is spiking with people 30-34 years old. Or, in the example below, that a certain venue is responsible for the issue which is then cascading to several other segments.
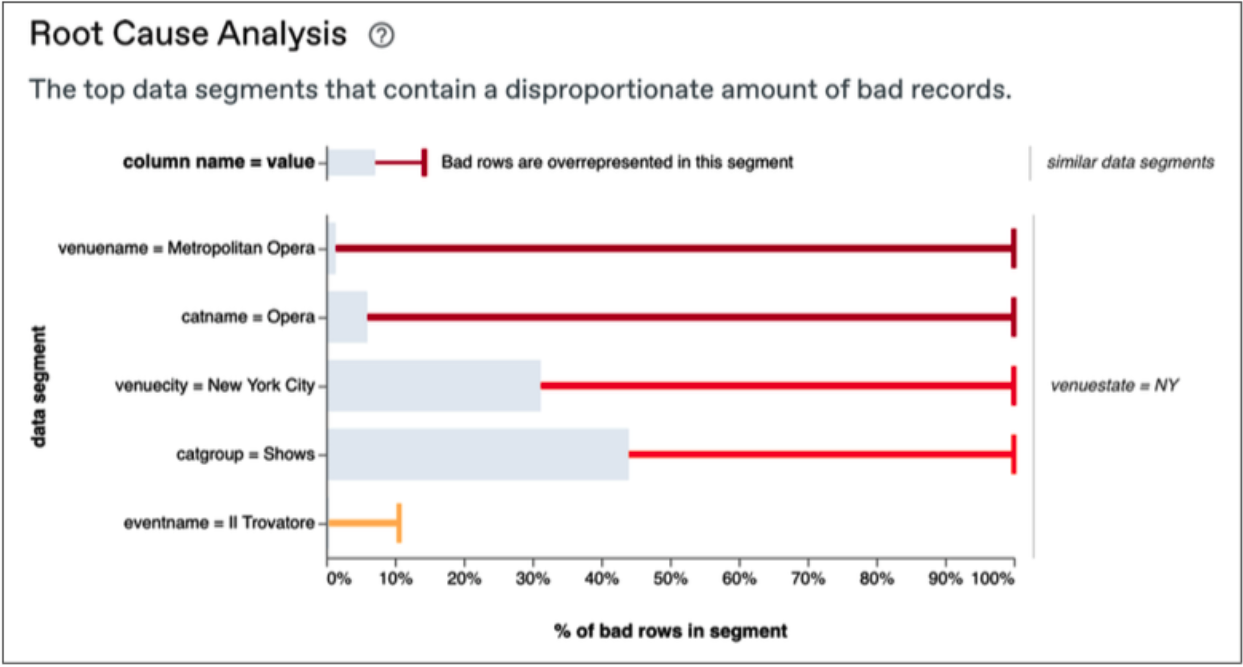
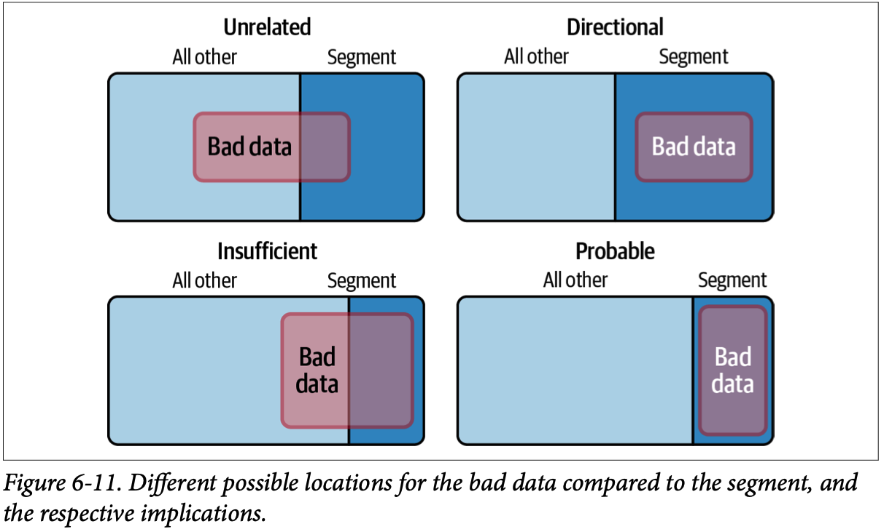
In a nutshell, RCA works by comparing the proportion of “bad” rows in a single segment to bad rows overall:
- If the proportion is about the same, the issue is unrelated to the segment.
- If the segment contains all of the bad data, but also plenty of good data, we have a directional indication of where to look but not a conclusive determination.
- If the segment itself is mostly bad data, but there’s similarly bad data in other segments, we have insufficient signal to draw a conclusion.
- But when all of the bad data is in a certain segment, and all of the segment is bad data, then it’s probable that it’s the root cause of the issue.
For more detail on Root Cause Analysis, we’ve got a thorough blog post on the topic. And with autonomous data agents now able to talk to you about your data issues, there’s even more innovation to be excited about on the issue investigation front.
The bottom line on alerts
When properly designed and implemented, alert notifications and Root Cause Analysis visualizations can unlock great value from your automated data quality monitoring system. When done poorly, alert fatigue or ownership confusion (if not both!) can lead to big issues going unresolved for too long. You now know the fundamentals to do it right; check out the book for even more detail.
In the next chapter, we’ll cover integrations with data warehouses, orchestrators, catalogs, and consumers.
Categories
- Book
Related Resources
Learn more by browsing our library of announcements, guides, and technical deep dives on data quality.


Ready to Trust Your Data? Let’s Get Started
Meet with our team to see how Anomalo transforms data quality from a challenge into a competitive edge.